An Stats
The GAA analysis tool · club to county

Know what won and lost the game.

Tag it live from the line with your thumb, or off the recording that evening. Either way you finish with a report that opens by saying what happened in plain English — and the twelve clips that decided it.

One licence covers the whole club · Windows 10 and 11 · unlimited matches
  1. Tag. Big buttons on the touchline, or one keypress an event off the recording.
  2. Read. A report that opens with the match in plain English, and twenty-odd sections behind it.
  3. Show. Tag live with no video at all, then attach the recording afterwards — the same tags cut the same clips, with your drawings on them.
  4. Keep. Every file, and the whole season's database, backed up to your own Google Drive.
Match report · Full time
ScorelineFull time · 70:00
Kilcarn Gaels2-3-13 (25)
Drumcarrig Emmets1-1-12 (17)
Kickout retention
63%
17 of 27 won · restart platform
Expected pointsKilcarn Gaels
23.4 xP → 25
Finishing +1.6 · Drumcarrig Emmets 16.4 xP
Point Two-pointer Goal Wide Short Saved dashed = from a free
Shot map at the attacking goal Kickout map from the restart Heatmap where they played

Drawn from a sample match report — County SFC Quarter-Final, 14 June 2026.

Fully offlinenothing leaves your laptop unless you turn on Drive backup
No analyst requiredbig-button tagging on the touchline, one thumb
Four codesfootball, hurling, camogie, ladies football
€149 a yearone licence, the whole club, every feature in it
Tagging

You don't need an analyst. You need one pair of hands.

Kickouts, shots, turnovers, frees, blocks, tackles and discipline — captured as fast as the game happens, from the line with your thumb or off the recording that evening. No spreadsheets, no second screen, nobody sitting behind a laptop.
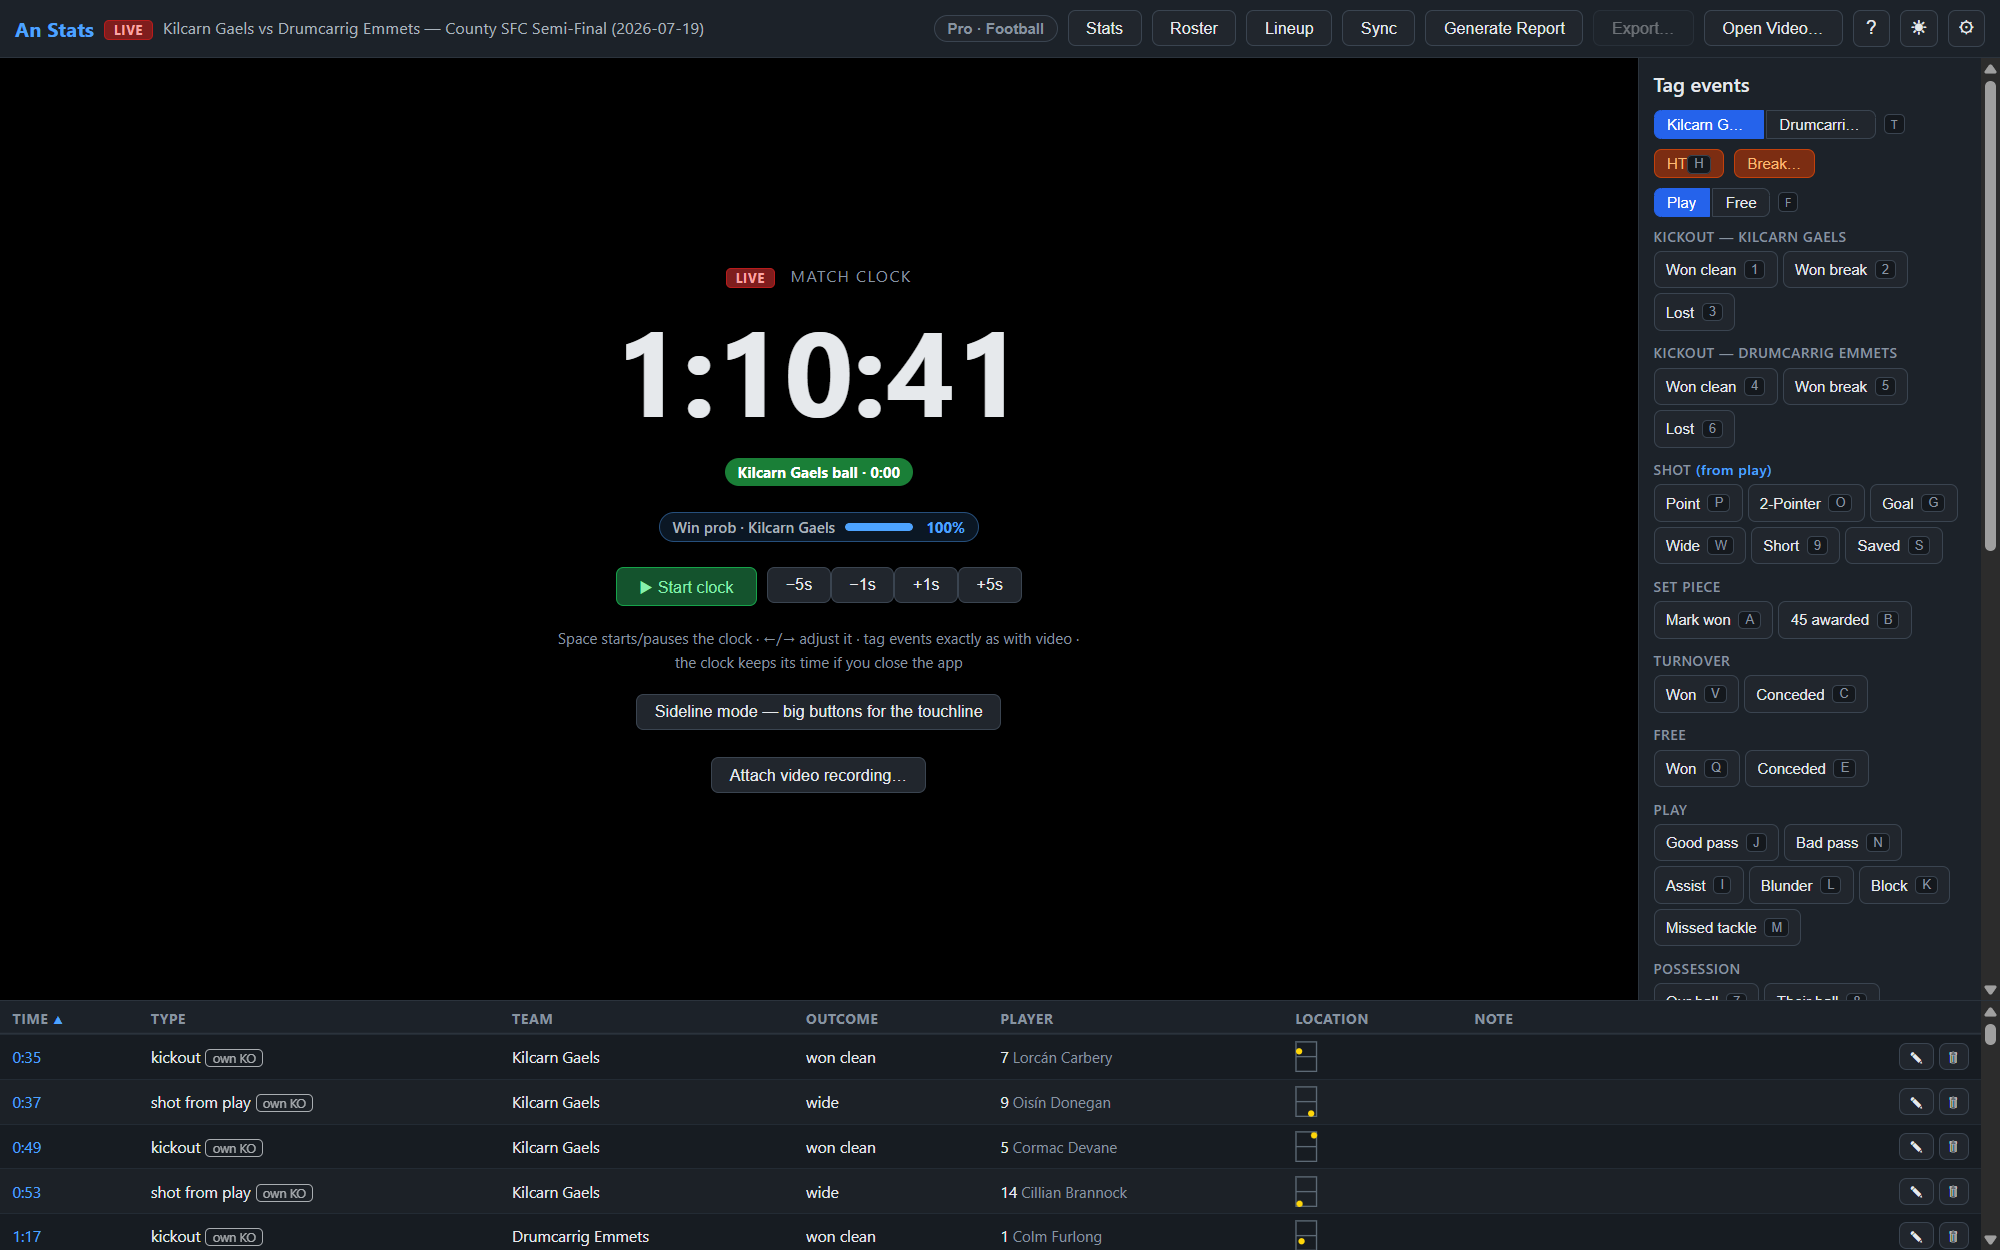
An Stats live match screen: match clock, possession and win-probability chips, the full tagging panel and a long event list
Tagging live with no video at all — the match clock, the full tag panel and the running event list, at full time.
On the line

Big buttons, one thumb, no rig

  • Oversized buttons under a running scoreboard and clock, at three detail levels — Simple, Detailed or Full — switched mid-match on the screen itself
  • Kickouts logged won clean, won on the break or lost, with short, mid or long armed for the next one on Full — plus turnovers, frees and tackles
  • A possession chip with Our ball, Their ball, Contested and Play stopped — the same clock the desk screen and the report run on
  • Tap the pitch to say where it happened. Shots here are from play, and player numbers need the full panel — attach the recording later for those
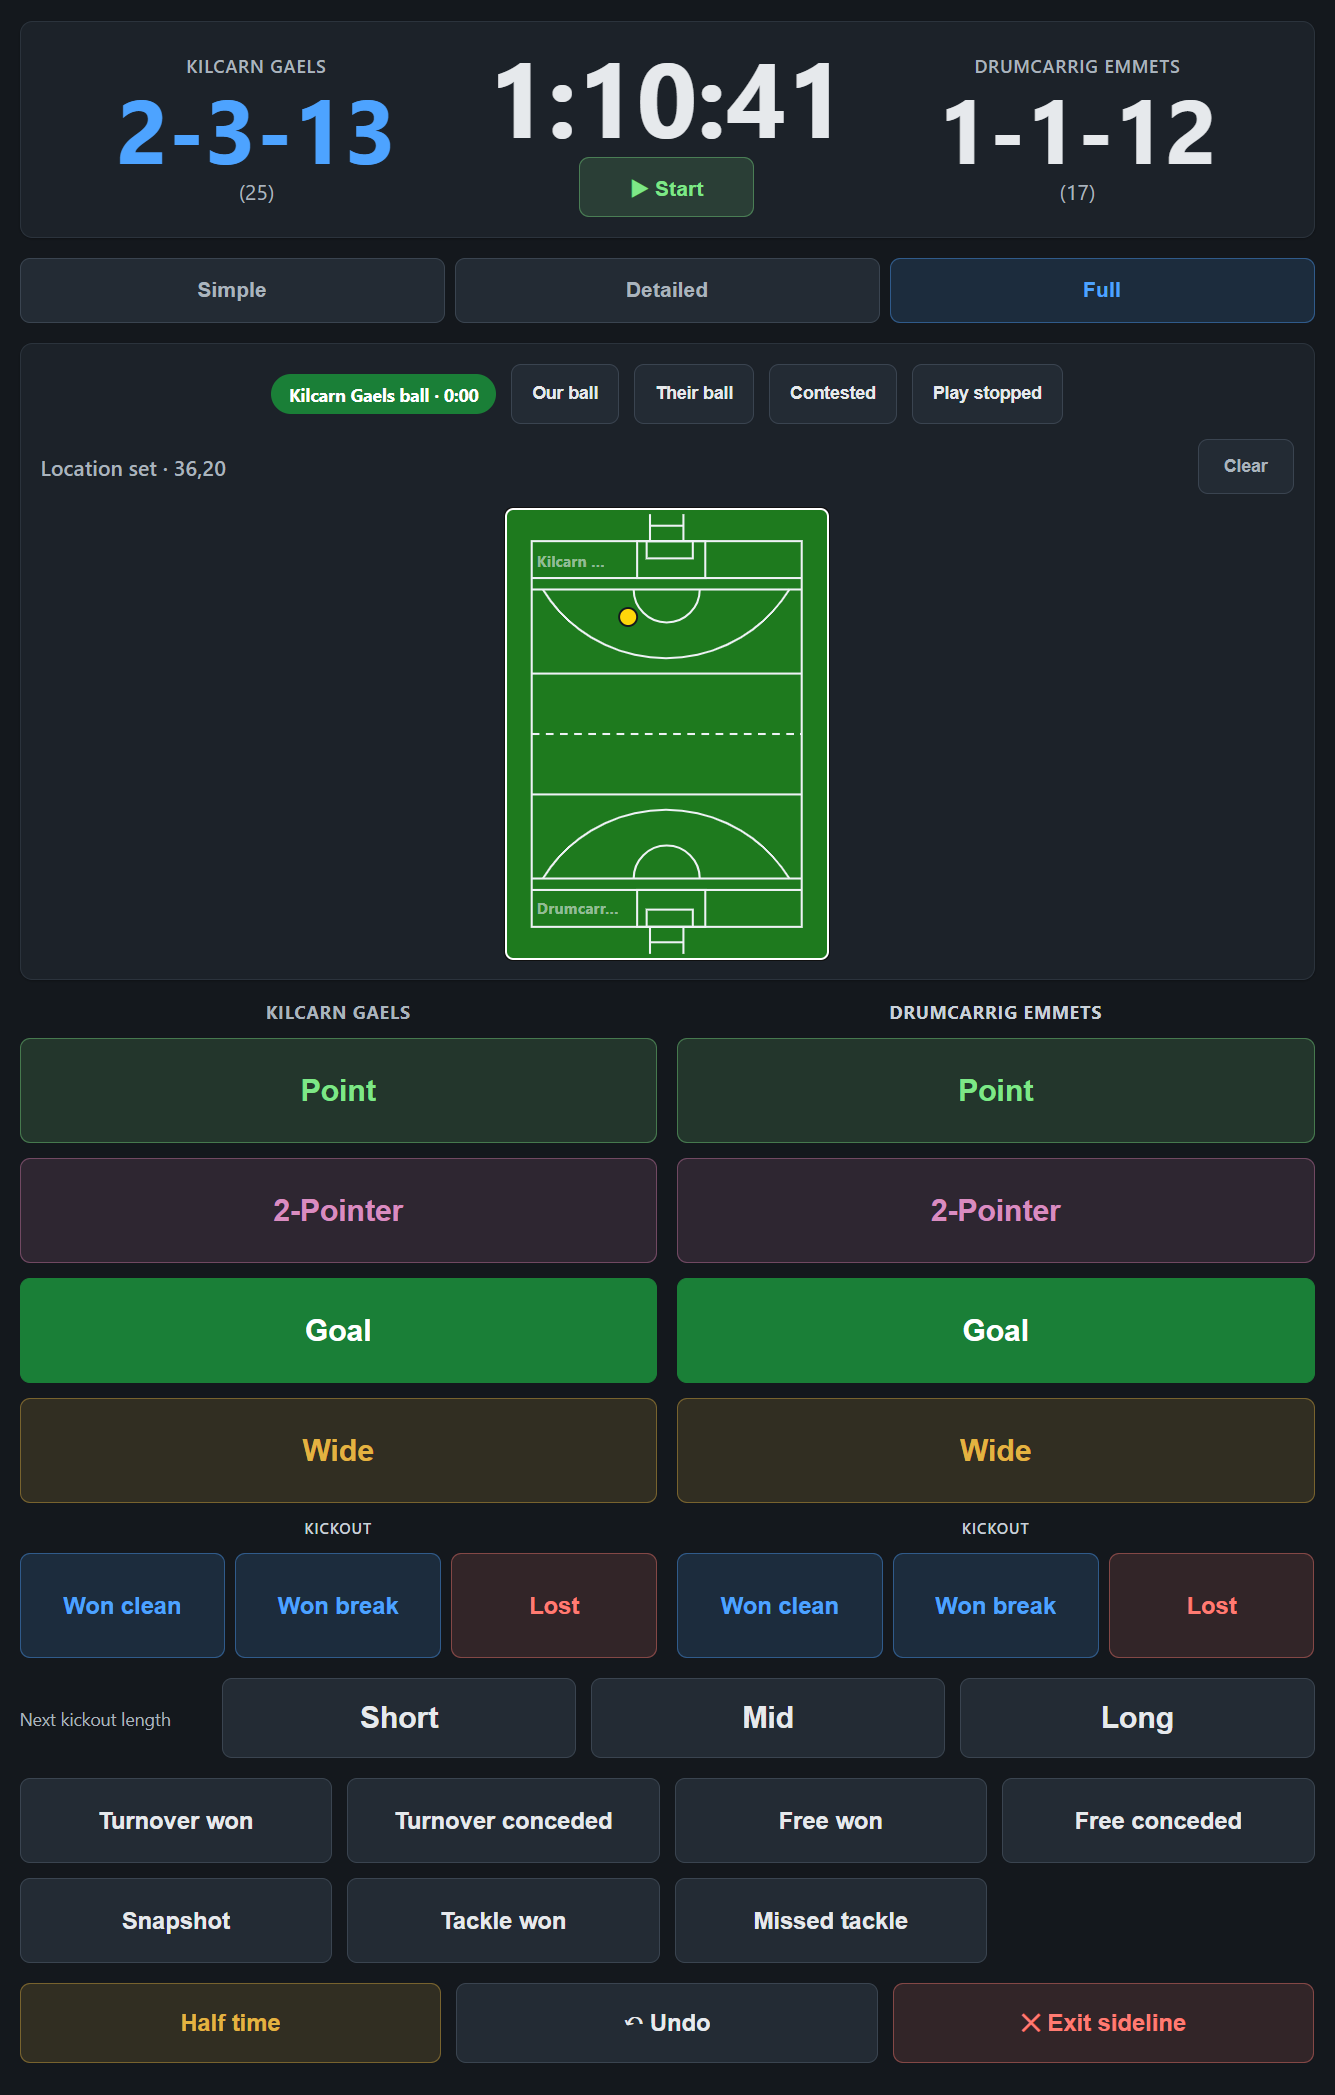
Sideline mode: detail-level toggle and possession chip above a tappable pitch map, with oversized score, kickout, turnover, free and tackle buttons for both teams
Sideline mode on the Full level: the detail toggle, the possession chip, the pitch and the buttons — one screen, one thumb.
Half time

The half-time report, already made

  • One tap on the sideline screen opens a visual match report — scoreboard, score worm, kickout bars, shots, turnover and free counts
  • Once the second half starts it shows what changed after the break — score, shots and kickout win rate, half by half
  • Pitch maps for both teams — shots, kickouts, turnovers, each with its own legend — built from the same numbers as the printed report
  • Save it as an image into the match's folder, and its Drive backup, for the group chat — offline, and the same match always makes the same picture
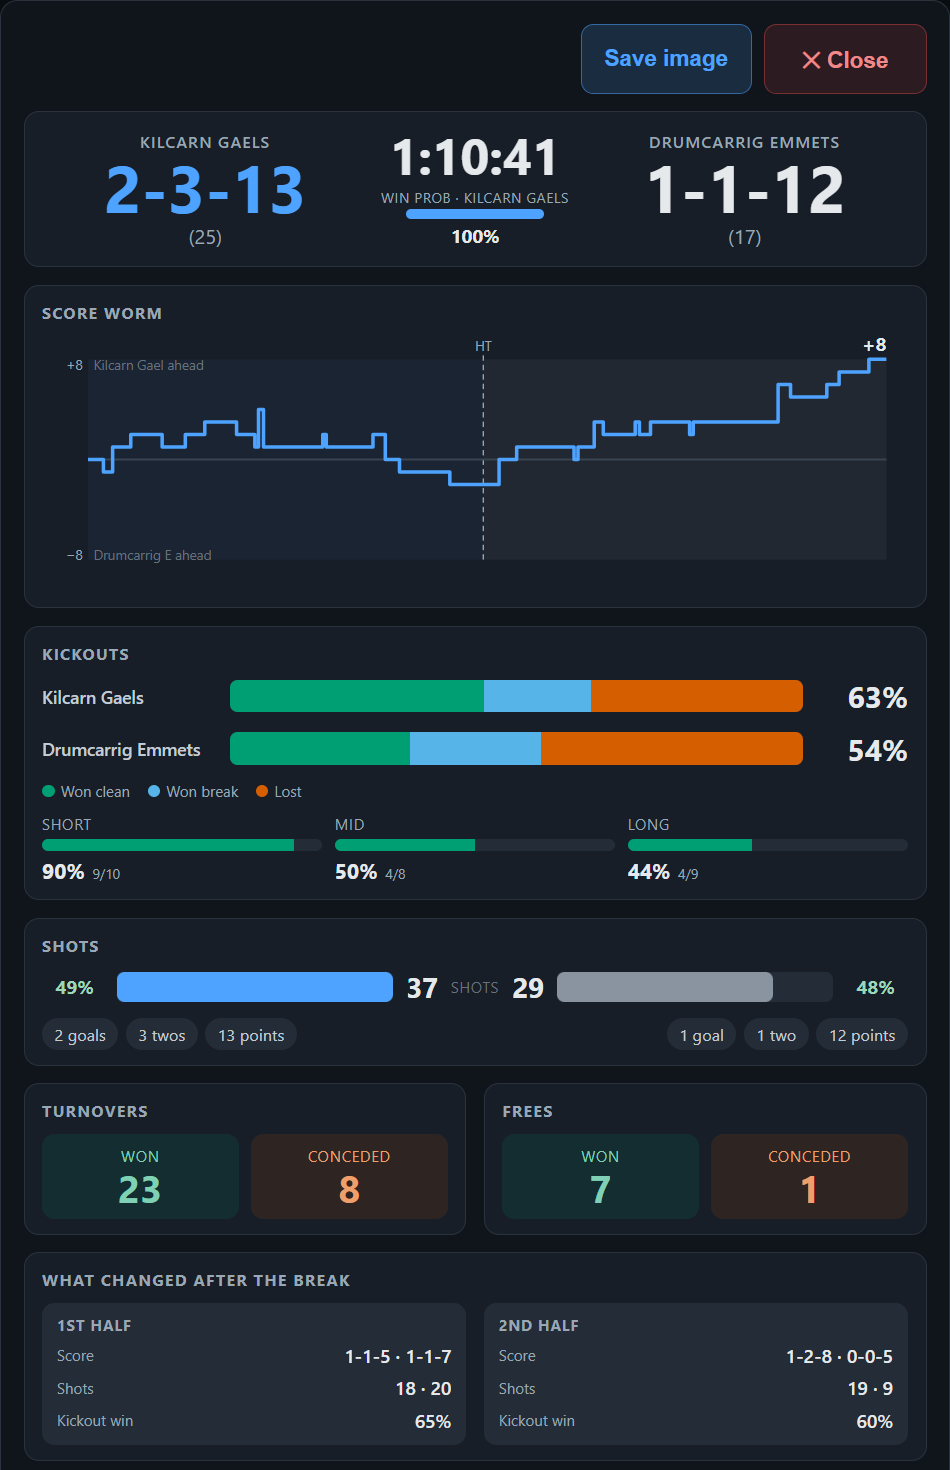
Sideline snapshot: dark one-page visual match report with scoreboard, score worm, kickout bars, shot and turnover counts, half-by-half splits and per-team pitch maps with legends
The top of the sideline snapshot — the per-team pitch maps follow underneath.
Off the recording

One keypress an event, and the video keeps up

  • Drag any recording onto the window and it plays — camcorder, phone, or a Veo-style camera export
  • Every tagged event becomes a coloured marker on the scrubber; click one and the video jumps straight back to it
  • Place locations however suits — click the pitch, arm a keyboard grid and press one key, or tag first and place it after
  • Rename or hide any button and define your own events; they carry through the reports and the exports like everything else
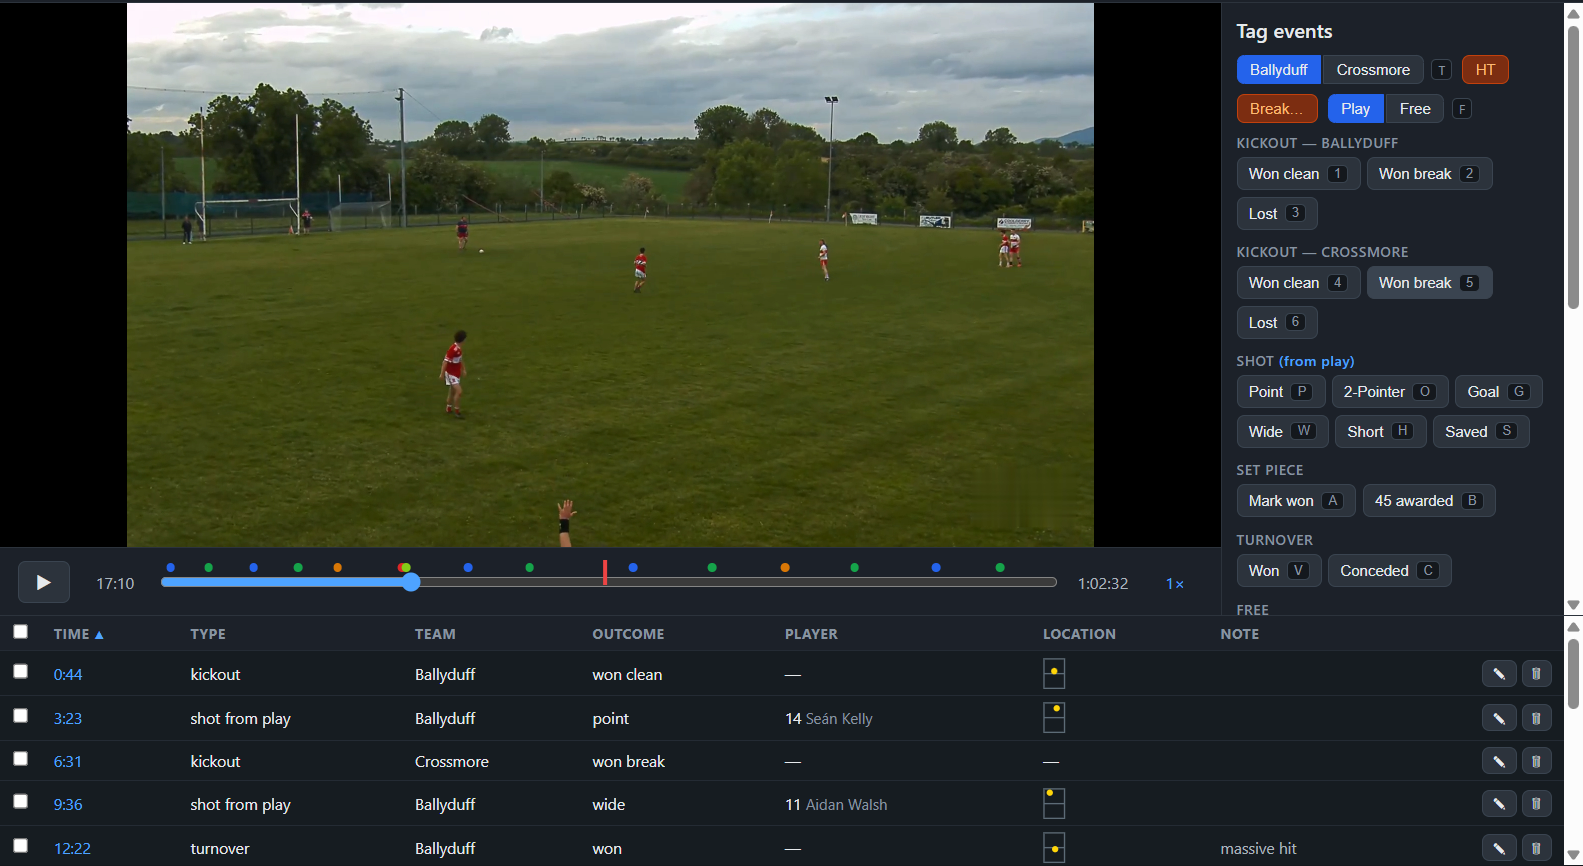
An Stats: match video with the hotkey tagging panel and live event list
Video, the hotkey panel and the live event list — one screen. A separate sample match.

Standard, Advanced or Pro

Pick how much of the app you want to see. Standard is the essential buttons and no hotkeys; Advanced puts every tag group and the season tabs on screen; Pro adds shot pressure, goal intent and kickout length. Same licence, same data, switch whenever you like.

Touch mode

One setting enlarges every button, toggle and the pitch map for finger tagging on a Windows tablet or a touchscreen laptop.

Every shot, with its story

Point, two-pointer, goal, wide, short or saved, from play or from a free, and where on the pitch it was struck — with the pressure it was taken under if you're tagging in Pro.
The report

Twenty-odd sections. Still no extra work.

Press Generate Report and everything you tagged becomes a document you would be happy to hand to a county board. On a fully tagged match it runs to well over twenty sections — and it opens by telling you, in sentences, what actually happened.

Sample match report · County SFC Semi-Final · 19 July 2026
Kilcarn Gaels 2-3-13 (25) v Drumcarrig Emmets 1-1-12 (17)
37 · 29Shots
49% · 48%Conversion
23.4 · 16.4xP
63%Own kickouts won
0.33 · 0.30Pts / possession
23 · 9Turnovers won
16 · 12Wides
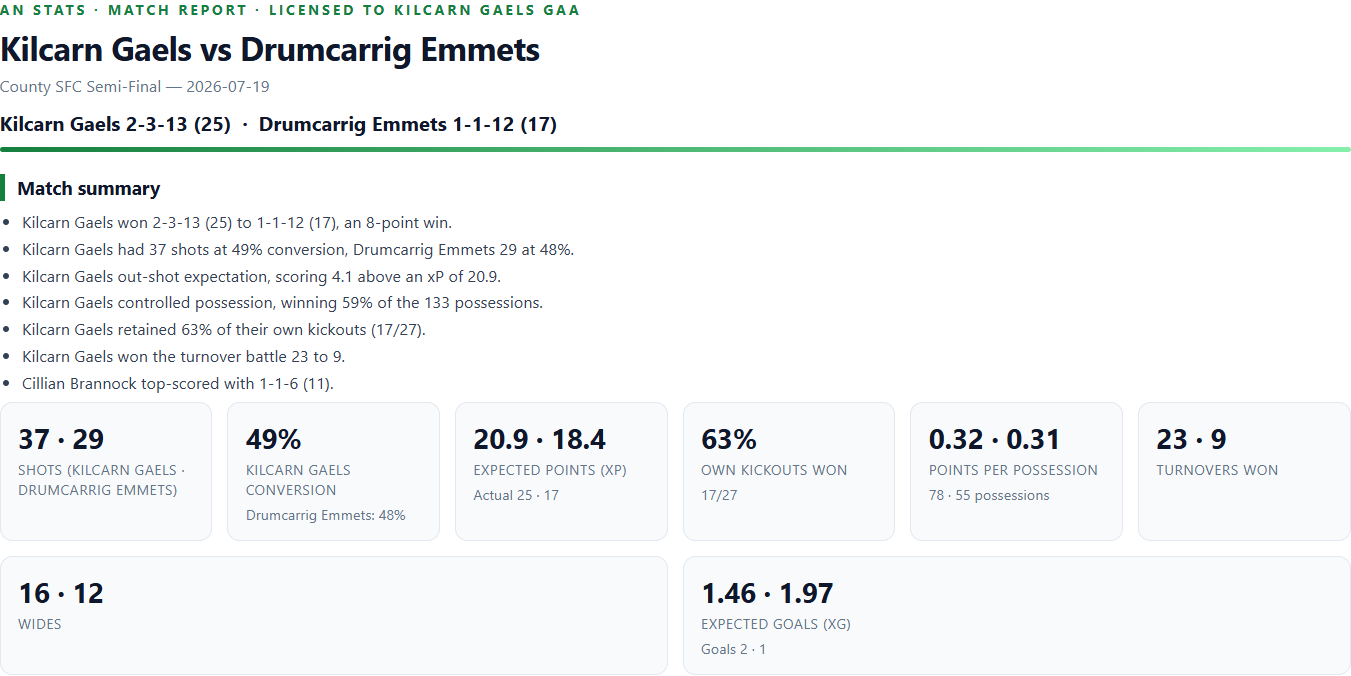
Match report opening with a plain-English match summary and a row of headline statistic cards
The match summary — written from your own tagged events, before a single table.

Result and margin, shots and conversion for both sides, finishing against expected points, possession share, restart retention, the turnover battle and the top scorer — up to seven sentences, built from the same numbers as the tables below them, so the two can never disagree. No AI and no connection: the same match always produces the same paragraph, and a lightly tagged match simply produces fewer lines.

Win probability

Know what your lead is actually worth

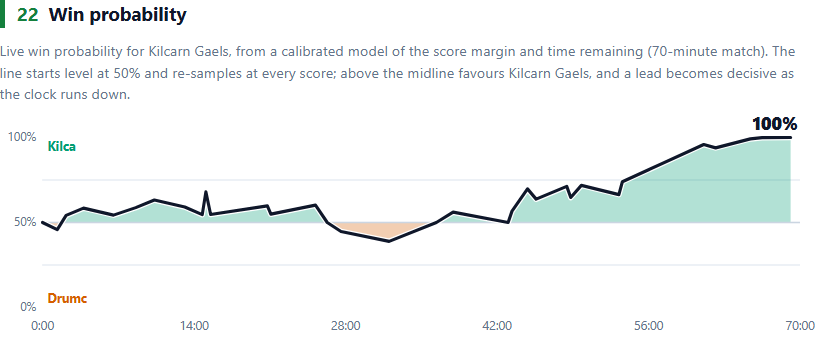
  • A chip beside the clock while you tag, and a full timeline in the report showing every swing
  • Six points up with twenty-five minutes left is not six points up with five minutes left, and the number moves as the clock does
  • Level at throw-in, re-sampled at every score, so the shape of the game sits on one line

It is a calibrated formula, not a trained model. It reads the score margin and the time left, and nothing else — not the wind, not a sending-off, not who is on the pitch.

Win probability timeline chart in the match report, stepping at each score across a 70-minute match
The win-probability timeline — level at throw-in, re-sampled at every score.
Context

Was that us, or was that a bad day?

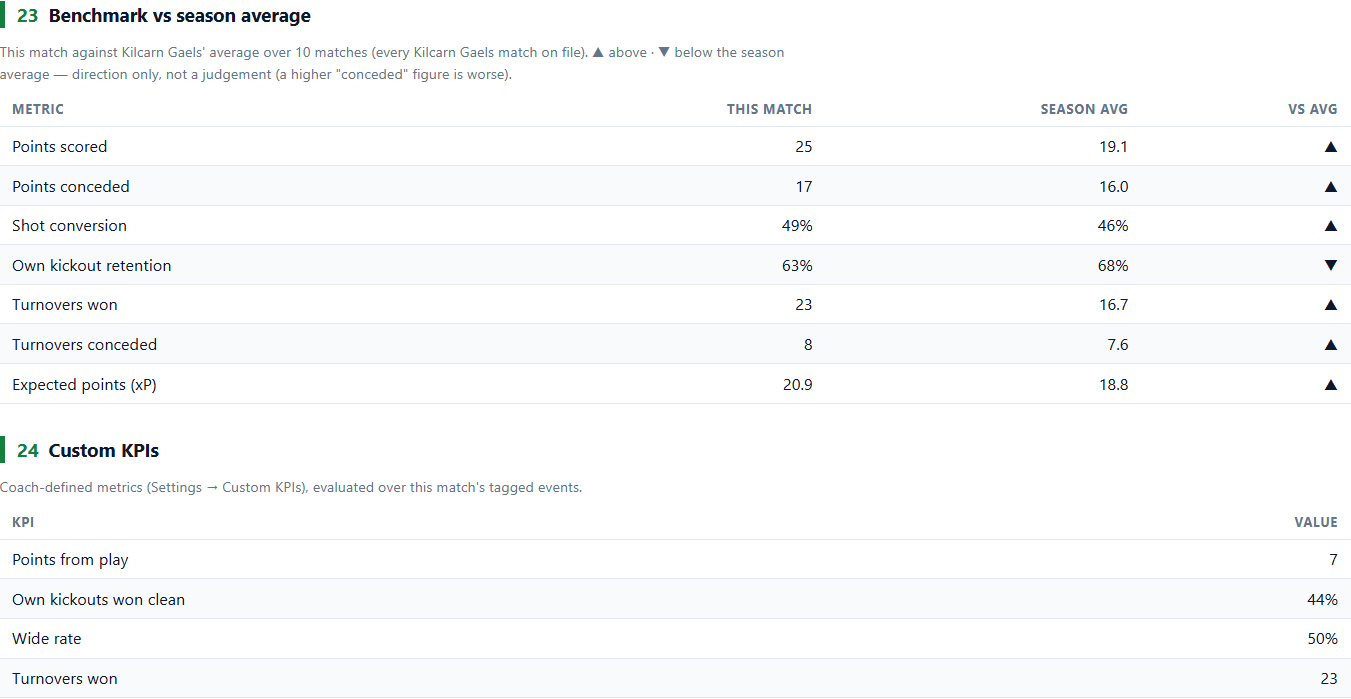
  • Scored, conceded, conversion, restart retention, turnovers and expected points — each beside your own average for that team, with an arrow for above or below
  • And your own numbers: build a KPI once from dropdowns — event, outcome, team, as a count, percentage or ratio — and it appears on every report from then on

The average is your own previous matches. There is no county or national dataset behind it, and it needs at least two matches on file for that team.

Benchmark table comparing this match against the team's season average, above a table of the club's own custom KPIs
Benchmark vs season average, with the club's own KPIs underneath.
The pitch, mapped

Where every shot was actually struck

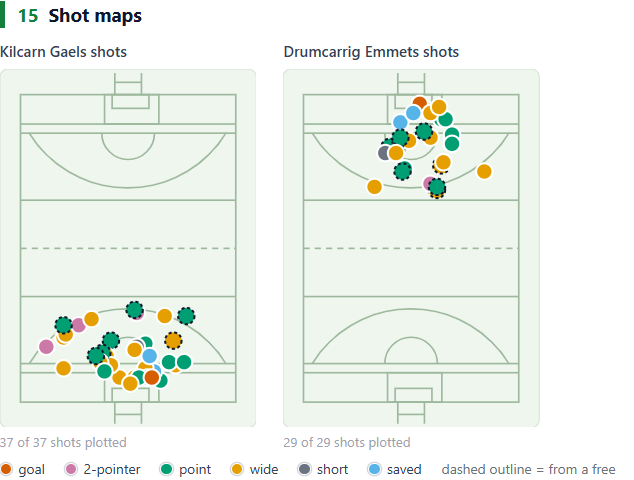
  • Locations captured with one click during tagging become shot maps, restart maps and activity heatmaps — carried full size, for both teams
  • Opposition maps are normalised to attack the same goal, so the patterns hold from game to game
  • Shots are grouped by the pressure they were taken under, with expected points per shot in each bucket
Shot maps for both teams plotted on pitch diagrams with an outcome legend
Shot maps for both teams, with the outcome legend.
The restart battle

The phase that decides most games, on evidence

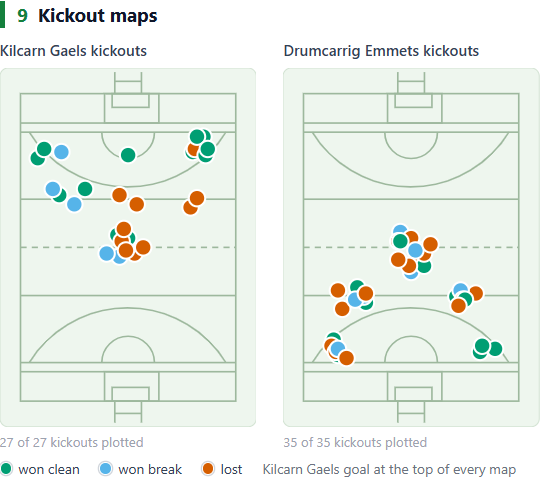
  • Every kickout and puckout plotted where it landed, coloured won clean, won on the break or lost, for both teams — normalised so your goal is always at the top
  • Split by length too: in the sample match Kilcarn keep 90% of their short restarts and 44% of their long ones, against the opposition's 67% short — the read that changes the next one
  • The same breakdown of any opponent builds up in their scouting dossier, meeting by meeting, so you know their tendency before throw-in
Kickout maps for both teams, each restart plotted and coloured won clean, won on the break or lost
Every restart, plotted and colour-coded — both teams, same goal at the top.

Minutes, and what they're worth

Set the starting fifteen, log the subs, and every player's scoring is normalised to a full 60 or 70. Two points in twenty minutes off the bench reads very differently to two in a full game.

Filter it to what you're discussing

Print the second half on its own for the debrief, or every kickout in the game on one page. The report drops the sections that would be empty rather than printing blank charts.

Kilcarn Gaels won 2-3-13 (25) to 1-1-12 (17), an 8-point win. Kilcarn Gaels had 37 shots at 49% conversion, Drumcarrig Emmets 29 at 48%. Kilcarn Gaels out-shot expectation, scoring 1.6 above an xP of 23.4.

— the first three lines of the match summary, written by the report itself. Sample match.
The video session

Draw on it, cut it, send it.

Everything Tuesday night needs, built from the same tagged events — no editing software, no second application, no Sunday evening lost to scrubbing.

Twelve moments, one reel, one click

  • Export key moments takes the twelve highest-impact events of the match — goals, two-pointers, scores from play, the turnovers that led straight to a score — and cuts them into one video in match order
  • Or ask a real question: every attack that came off our own kickout and ended in a shot. Filter by possession source, by type, team or player, and export exactly that
  • Every clip is cut and named for you — 03 - Shot from play, point - #14 Cillian Brannock.mp4 — with no re-encoding on the standard path, so a full match exports in minutes

Key moments are ranked by a fixed rubric — a goal outscores a two-pointer, which outscores a point from play — not by how good the footage is. Clip export needs a video attached to the match, and burning drawings into clips re-encodes those ones, which takes longer.

Telestration — draw on a paused frame

Pause the video and draw straight onto the frame: pen, arrow, line, box, ellipse, a spotlight that dims everything but one player, or a shaded channel. Save it as an image for the projector or the group chat, or attach it to the tagged event so it reopens on that exact frame next week.

Drawings that travel with the clip

Tick one box on export and the drawing is baked into the clip itself, so the arrows and circles play anywhere — any player, any phone — with no explanation attached.

Custom playlists, straight from the event list

Tick any selection — every shot from number 14, every lost kickout — and press play; the app runs it as a playlist. Build a different one for forwards, backs and the management meeting from the same match.

Pricing

One licence, everything in it

No tiers, no feature gates, no "contact sales". One annual licence per club or school, every feature on this page included, unlimited matches, and every update while you're licensed. Over a season that is under €6 a match.

Want to see the reports before you tag anything? Email us for a trial key — it unlocks the app, and pressing Load example match puts a fully tagged sample game in there with both rosters, shot maps, kickouts, expected points and the match report. Then run it on your own footage.

Annual licence
€149 / year
per club or school
  • Tagging, reports, clips, telestration, sideline mode, scouting — all of it
  • Standard, Advanced and Pro modes — one licence covers all three
  • All four codes — football, hurling, camogie, ladies football
  • Unlimited matches, players and seasons
  • Every update while licensed, and direct email support from the people who build it
Buy An Stats
Secure card checkout via Stripe — your licence key is emailed to you within minutes.
Prefer an invoice? Email us. Prefer to try it first? Free trial.
Education pricing available for schools and colleges.
Players and the opposition

The season view, for every name on the sheet

The events you tag during matches build into season-long profiles of your own players — and dossiers on every opponent you meet.

Your players

Individual development, documented

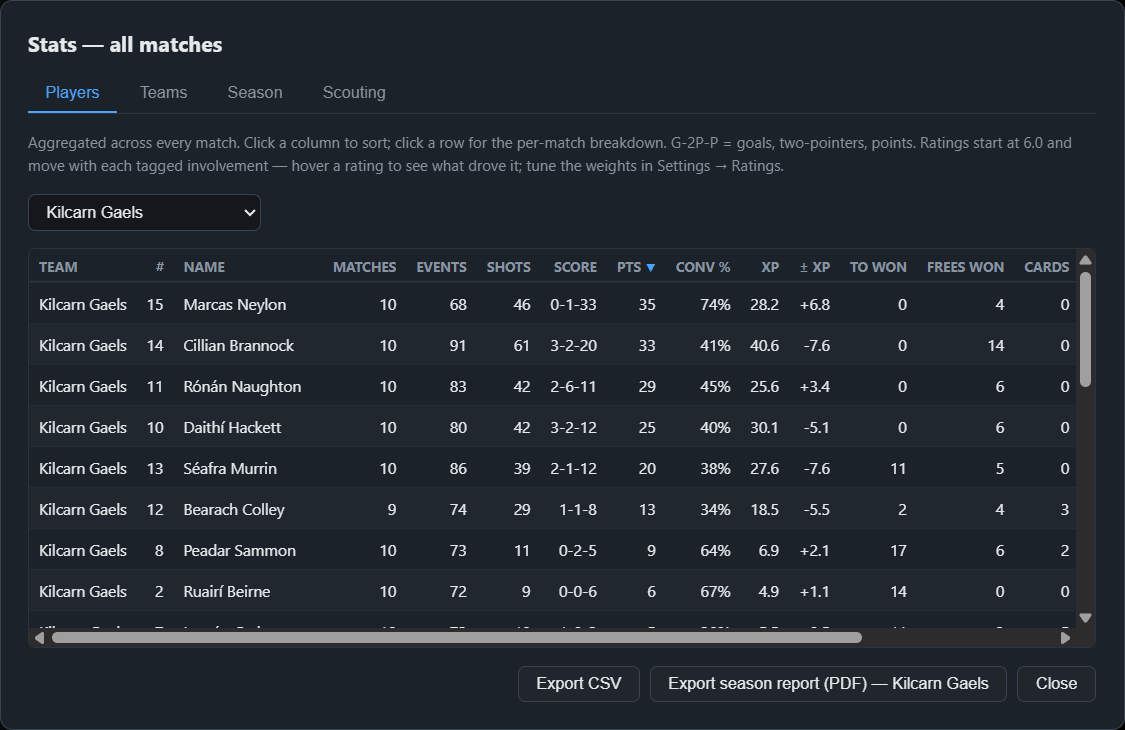
  • Season statistics per player — matches, minutes, shots, score, conversion, expected points and finishing ±, turnovers and frees won, cards
  • A match rating for every player, earned one involvement at a time — scores, turnovers, blocks and frees won lift it; bad passes, missed tackles and cards pull it down. Hover any rating to see exactly what drove it
  • The weights are visible and you can tune them in Settings to your own game model. Only what you tag counts — it's a record of the analyst's log, not an opinion
  • A one-click development PDF per player: summary cards, points against expected points, the rating trend, a personal shot map and heatmap
Player statistics table aggregated across the season with goals, two-pointers and points, conversion, expected points and a rating per player
Player statistics across the season, with the per-match detail one click down.
The opposition, and the season

Scout them from your own tagging

  • Every tagged meeting with an opponent aggregates into one scouting dossier — scorer threats, restart patterns and length tendencies, turnover zones, points per possession by source
  • Their maps are normalised to attack the same goal, so the patterns hold from game to game
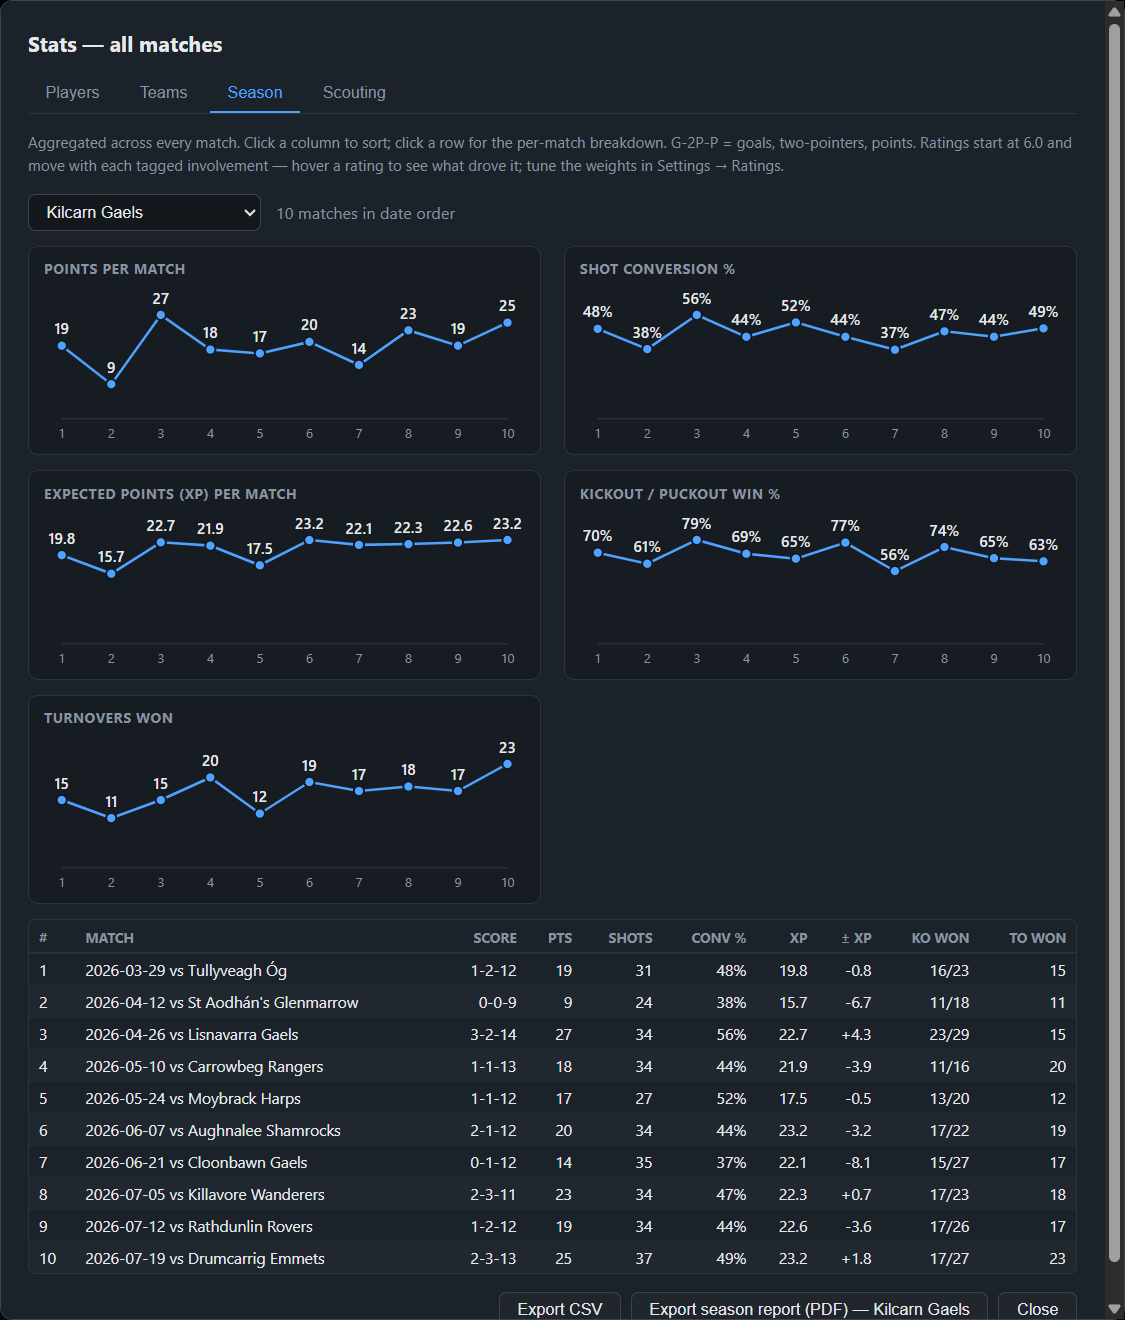
  • Season trend charts follow any team match by match — points, conversion, expected points, restart win rate, turnovers
Season view with trend charts for points, shot conversion, expected points, kickout win rate and turnovers, above a per-match table
Season trends — points, conversion, expected points and restart win rate, match by match.

Lineups, subs and game time

Mark the starting fifteen, the bench and anyone unavailable, log substitutions at the minute, and read each player's minutes as the game runs. It settles the "he doesn't get enough game time" argument with the actual minutes.

A report per player

Two pages a player, for the one-to-one review — and every scoring line normalised to a full 60 or 70 so a bench cameo is judged fairly.

A season report for the committee

The record, the trends, the results and the player statistics, gathered into one PDF for the AGM or the county board.

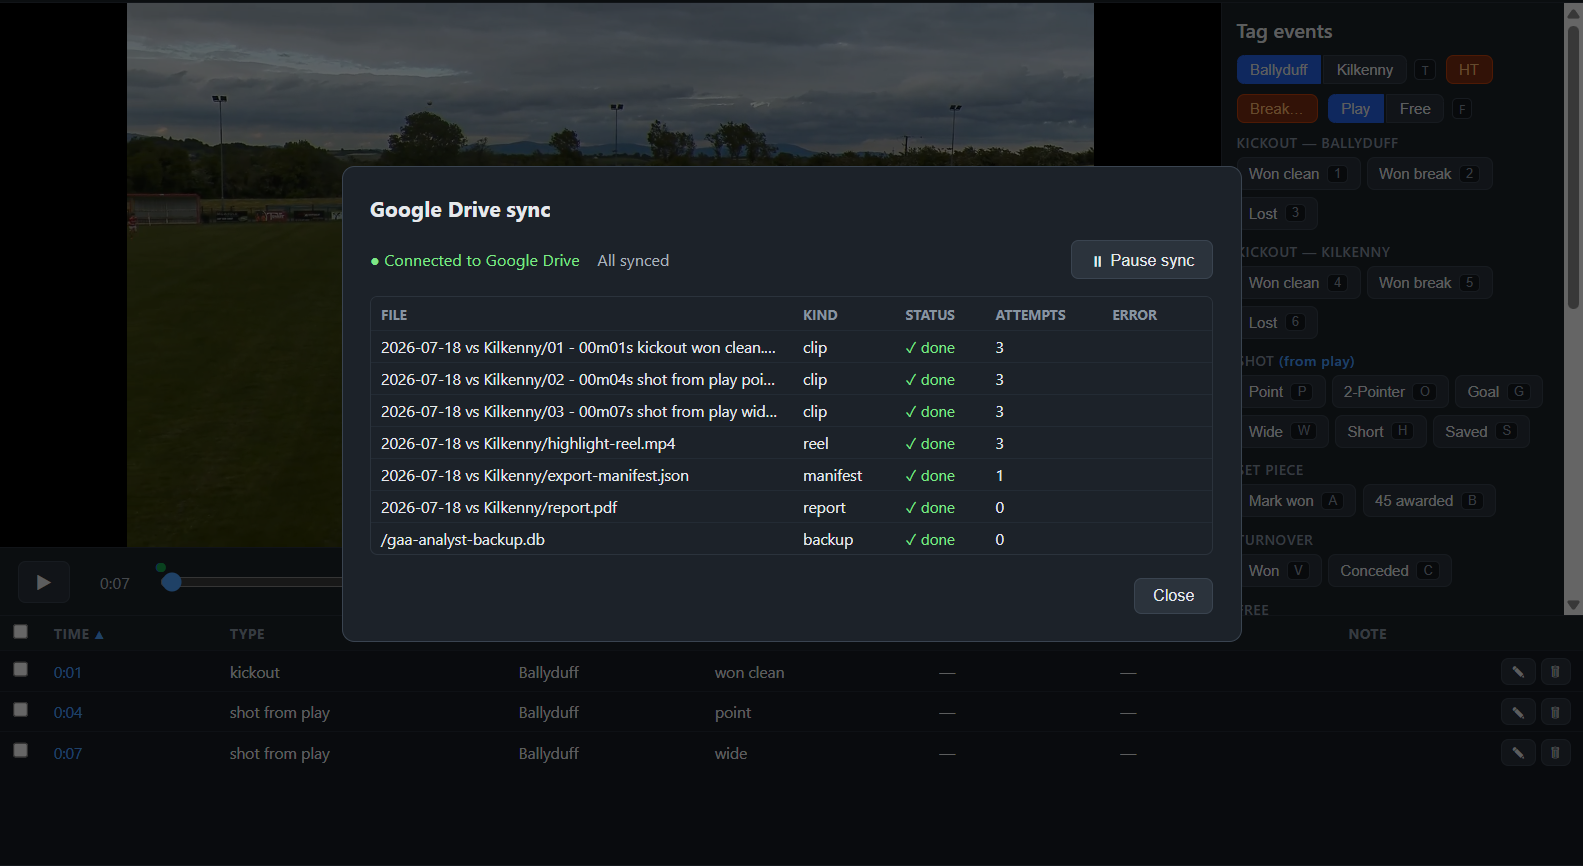
Google Drive, built in

Click once. Your season backs itself up.

Connect your Google account in a single click — no setup, no accounts to create. From then on every report, clip and a full copy of your database uploads to your own Drive automatically. Offsite, safe, out of your way.

  • One-click connect. Sign in through your browser and you're done — the app handles the rest. Nothing to configure.
  • Never lose a season. A full copy of your database backs up to your Drive automatically, so if a laptop is lost or stolen your whole season is safe in your Drive and can be restored.
  • Share once, they all see it. Share the An Stats folder with your management or squad and every report and reel you export simply appears for them — no emailing files around.
  • Private by design. Optional, and it's your Drive — nothing passes through us, and the app can only touch the folder it creates.
Google Drive sync window showing clips, highlight reel, report PDF and database backup all synced
Clips, the reel, the report and the database backup — synced to your Drive.
FAQ

Frequently asked questions

Does it really work fully offline?

Yes. The application, your video and your database all live on your own laptop — nothing is uploaded, and no connection is needed to tag, report or export. The optional Google Drive sync backs up your database whenever you're next online.

What video does it take?

Anything your machine can play — MP4 from a camcorder or a phone, Veo and similar camera exports. Drag the file onto the window and start.

Who does the licence cover?

One club or school per licence, used by its coaches and analysts. Separate organisations hold separate licences — and for county or multi-team setups, talk to us.

What happens to our data if we don't renew?

It's your data, on your machine, in a standard SQLite database. It never expires, and your exported reports, clips and CSVs are yours forever. Renewal covers updates and support.

What are the system requirements?

Windows 10 or 11, 64-bit. Any laptop from the last several years runs it comfortably — clip export uses stream copy, so there's no heavy re-encoding unless you ask for drawings burned in. macOS is on the roadmap; tell us if that's what your setup needs.

How are player ratings worked out?

Every player starts a match at 6.0. Each involvement you tag carries a visible weight — a goal +3, a turnover won +1, a bad pass or missed tackle −0.6, a card more — and the rating is 6.0 plus 0.35 × the total of those weights, clamped between 1 and 10. In practice a goal is worth about a point of rating. Hover any rating in the app to see the involvements behind it, and tune every weight in Settings → Ratings to match how your management team values the game. Only what you tag counts: it's a record of the analyst's log, not an opinion.

How does expected points work?

Each shot gets a scoring probability from where on the pitch it was taken, times the value of what it produced — a goal 3, a two-pointer 2, everything else 1. Frees are modelled as more repeatable than shots from play, and shots without a tagged location fall back to fixed default probabilities. Because the value comes from the outcome, xP measures shot location and shot value together rather than pure chance quality: finishing ± above xP means the team turned its shots into more than the model expects from where they were struck. The curves are hand-calibrated to typical GAA ranges, not fitted to a league dataset.

Who actually has to tag the match?

One person, and they don't need to be an analyst. Sideline mode puts oversized buttons on screen — score, wide, kickout, turnover, free — above a scoreboard and a clock, so a selector or a parent can tag the game from the line with one thumb and no video at all. It stores the same event types a desk analyst stores, so the scoreline, shot maps, expected points, possessions and turnover battle all come out the same. Player numbers and the Pro shot detail need the full tagging panel — add them from the recording afterwards if you want the per-player sections.

Is any of this AI?

No. The match summary that opens the report is written from your own tagged numbers by a fixed set of sentences — so the same match always produces the same paragraph, nothing is invented, and it works with no connection. The key-moments reel ranks events by a fixed rubric: a goal outscores a two-pointer, which outscores a point from play. Nothing is sent anywhere to be processed.

How does win probability work?

It is a calibrated formula, not a trained model. It reads two things — the score margin and the time left — and nothing else. It does not know about the wind, a sending-off, or who is on the pitch. What it is good for is the thing coaches argue about: six points up with twenty-five minutes left is a very different position to six points up with five minutes left, and the number moves as the clock does.

Can we track the numbers our management actually uses?

Yes. Build a KPI once from plain dropdowns — event, outcome, us or them, as a count, a percentage or a ratio — and it appears on every match report from then on. The report also benchmarks each match against your own average across every match you have on file for that team. That average is your own previous matches; there is no county or national dataset behind it, and it needs at least two matches on file.

Where do we download it?

Download An Stats for Windows (64-bit). The installer is free to download — the application asks for your licence key the first time it opens, so you can install it before or after purchasing.

The whistle goes. The report writes itself.

Everything on this page comes from one person tagging one match — on the line with a thumb, or at home with the recording.

Get An Stats